
Do remittance startups have a fundamentally different cost structure vs. incumbents? What are the primary customer acquisition channels for money transmitters? What can explain remittance startups’ massively higher relative valuations vs. established providers? If you are interested in such questions, this article is for YOU.
We will cover the following topics:
- Market Size
- Pricing
- Providers
- Digital Trends
- Users
- Business Models
- Acquisition Channels
- Valuations
Market Size
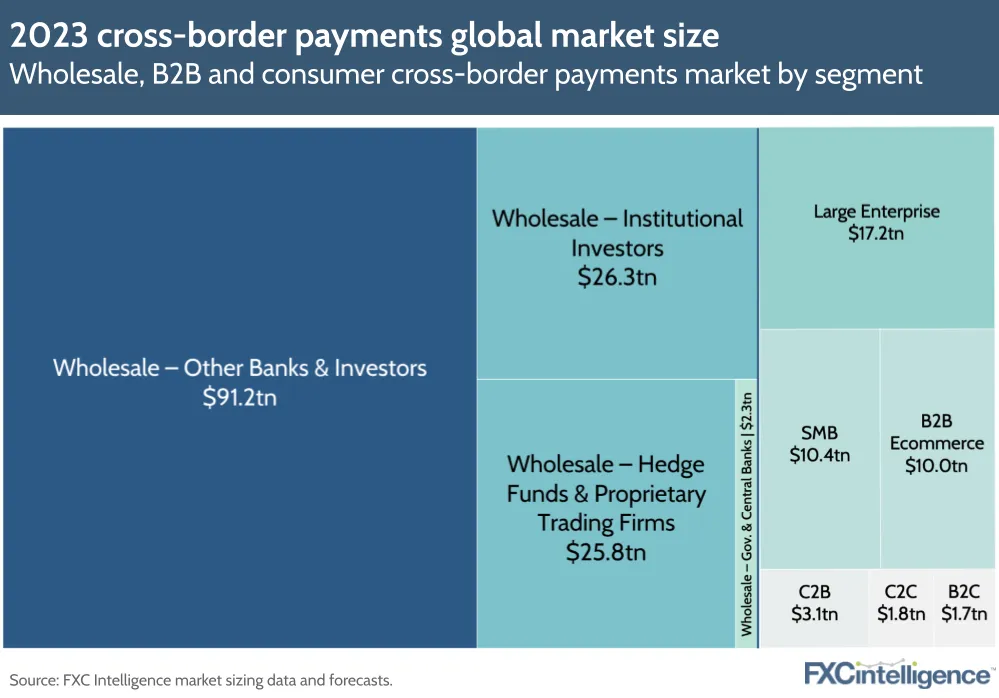
Remittances are the most common type of consumer-to-consumer (C2C) cross-border money transfers among consumers. They involve migrant workers sending money back home to support their families. This represents a small sub-section of cross-border payments with an annual volume of about $1 trillion. A similar number of C2C transactions are sent between people for other use cases (e.g., not migrants, to themselves, not to family members).
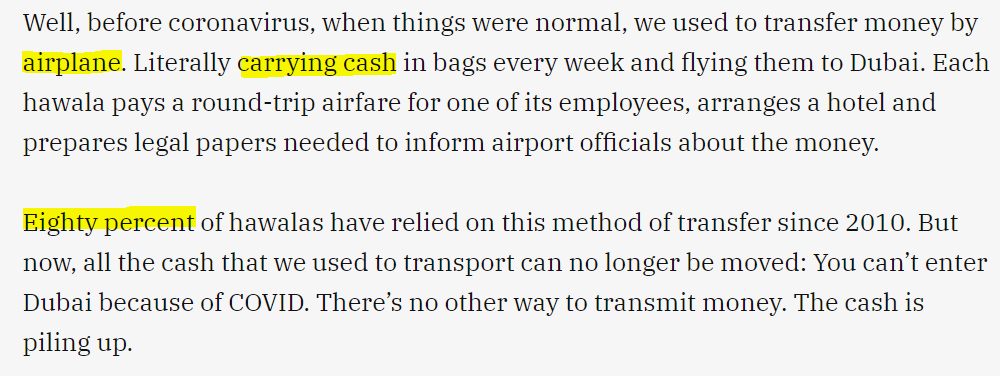
While formal money transfer channels are becoming increasingly popular, informal ones, known as “hawala,” continue to hold a significant market share in specific corridors. This is driven by consumers who wish to conceal their transfers and by “de-risking” practices by banks that refuse to send money to high-risk countries like Somalia:
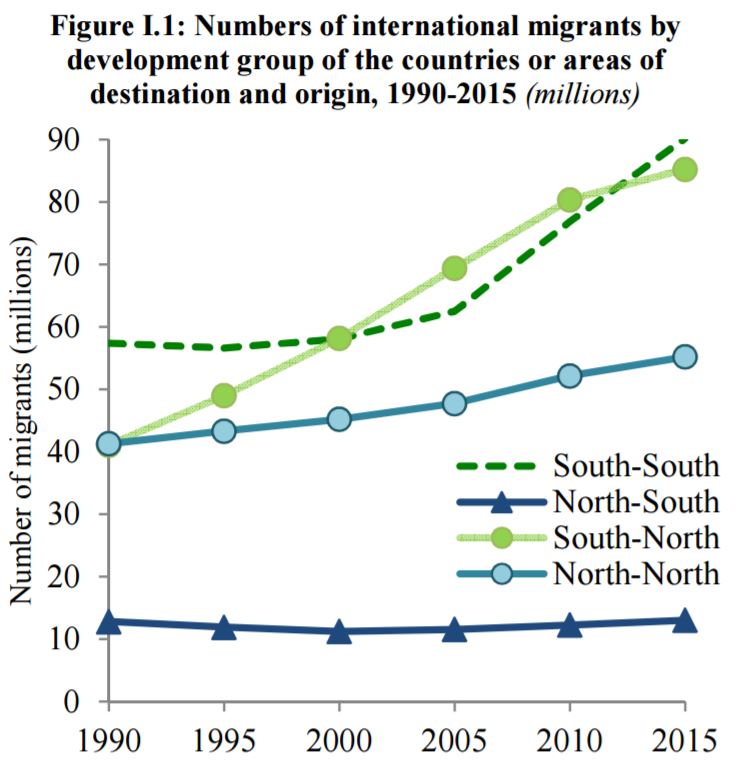
Remittances are correlated with the size of global migration, which experienced a significant increase from South to North countries in the 1990s and from South to South countries starting in 2005:
Source: UN
The growing migration means millions of new cross-border money transfer consumers every year. Even when a new entrant to the market can’t poach customers from incumbents, it can still grow significantly by capturing just-arrived migrants and expats.
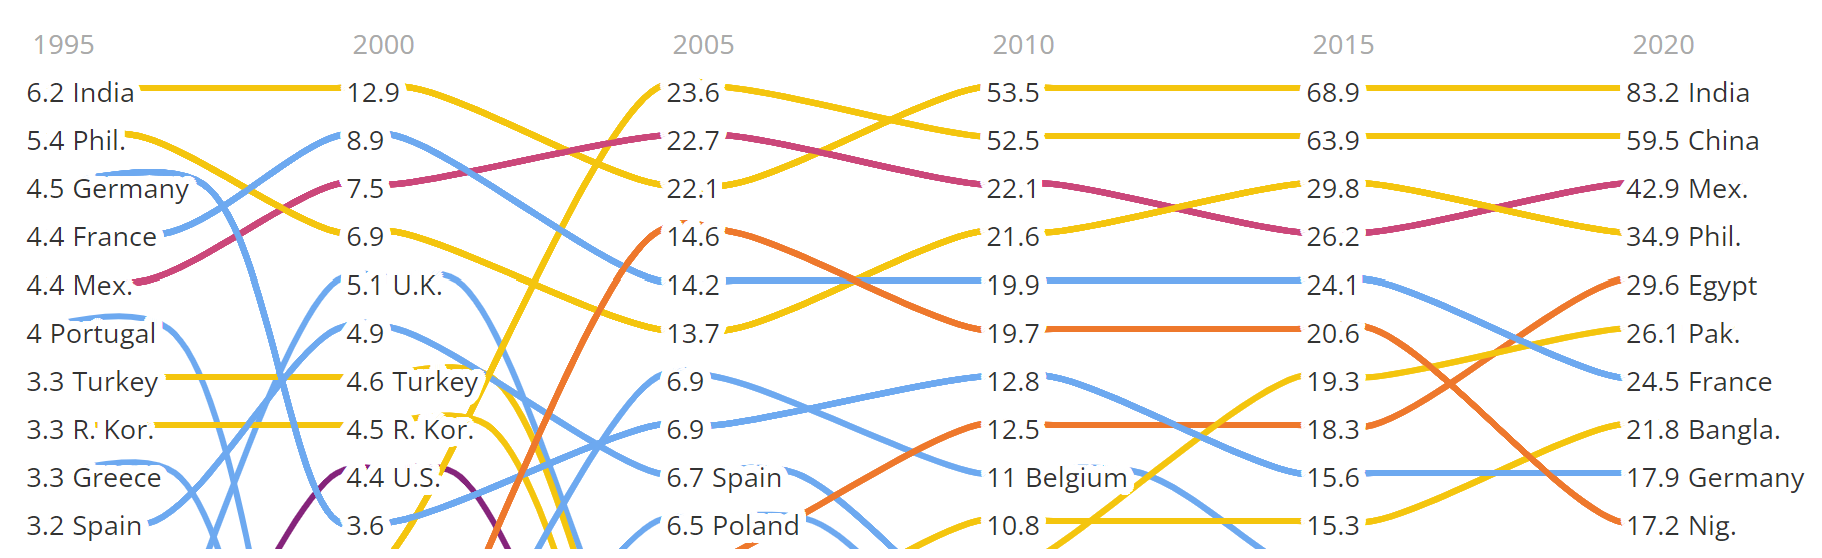
Migration patterns are directly correlated with changes in remittance volumes. For example, as China’s Communist Party began allowing immigration in the 1990s, the Chinese became the top immigrant group to the US. That made China the #2 largest destination for remittances by 2000, while it was not even on the radar in 1995.
Due to the relatively low margin (take rate) that companies charge for international money transfers, consumers collectively pay around $60 billion annually to money transfer providers. This includes both C2C and C2B use cases, such as education. C2C firms earn approximately half of that total amount. It’s important to note that a significant portion of C2C cross-border volume is still sent informally, sometimes referred to as hawala, and does not generate revenue for legitimate firms.
In the case of remittances, there is a notable concentration of countries that produce the most migrants and, consequently, receive money transfers from them. Inbound transfers to India alone represent more than 10% of global remittances. Transfers from the USA to Mexico constitute the world’s largest single corridor, accounting for more than 5% of the global remittance volume. Finally, remittances play an outsized economic role in certain countries, amounting to around half of their GDP.
Not surprisingly, there is a fundamental difference in the volume of remittances per person if booming and stagnating economies are separated. The lack of domestic opportunities naturally drives higher migration and inbound money transfers. Therefore, China and India receive only $50 per person. Meanwhile, Mexico, the Philippines, and Egypt get $300.
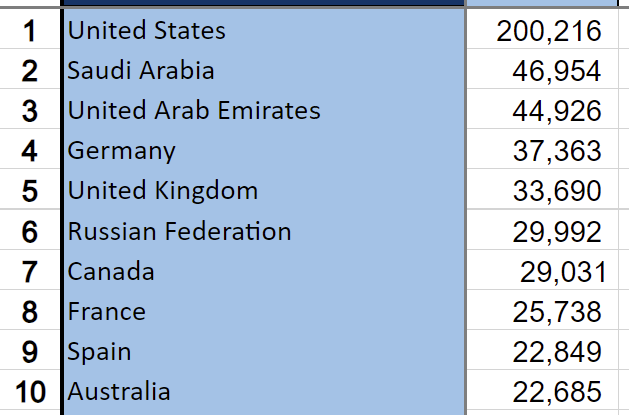
The US is, by far, the largest host of migrants, resulting in a dominating volume of outbound remittances, reaching $200 billion in 2021 or 25% of the global outbound total. Unsurprisingly, among the top 10 remittance senders are some of the world’s largest economies (see the image below, measured in USD million). However, it’s worth noting which top economies are missing: Japan, due to its very restrictive migration policies, and India and China, as they don’t have a labor shortage that would facilitate migration.
As a country becomes more developed, it tends to produce fewer migrants, shifting the balance of outbound and inbound remittances. For example, Turkey, which used to be a net receiver of remittances, saw a shift to a 60/40 ratio of outbound to inbound remittances by 2017, and by 2021, this had further skewed to a 90/10 ratio.
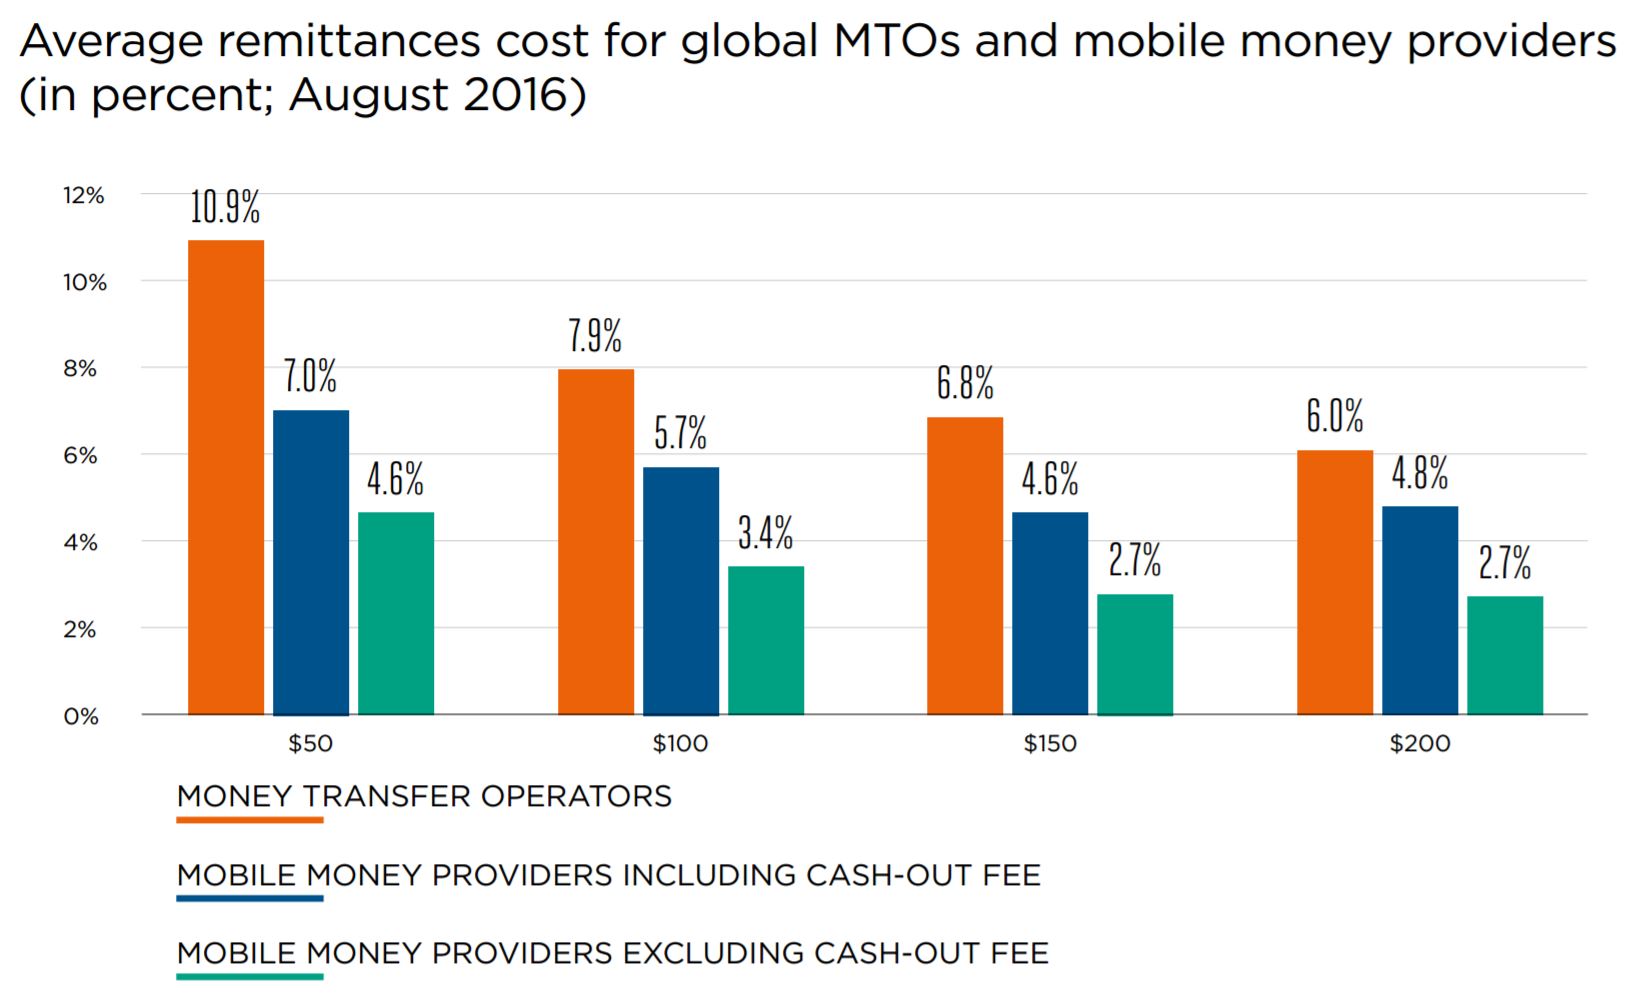
Cross-border Money Transfer Prices
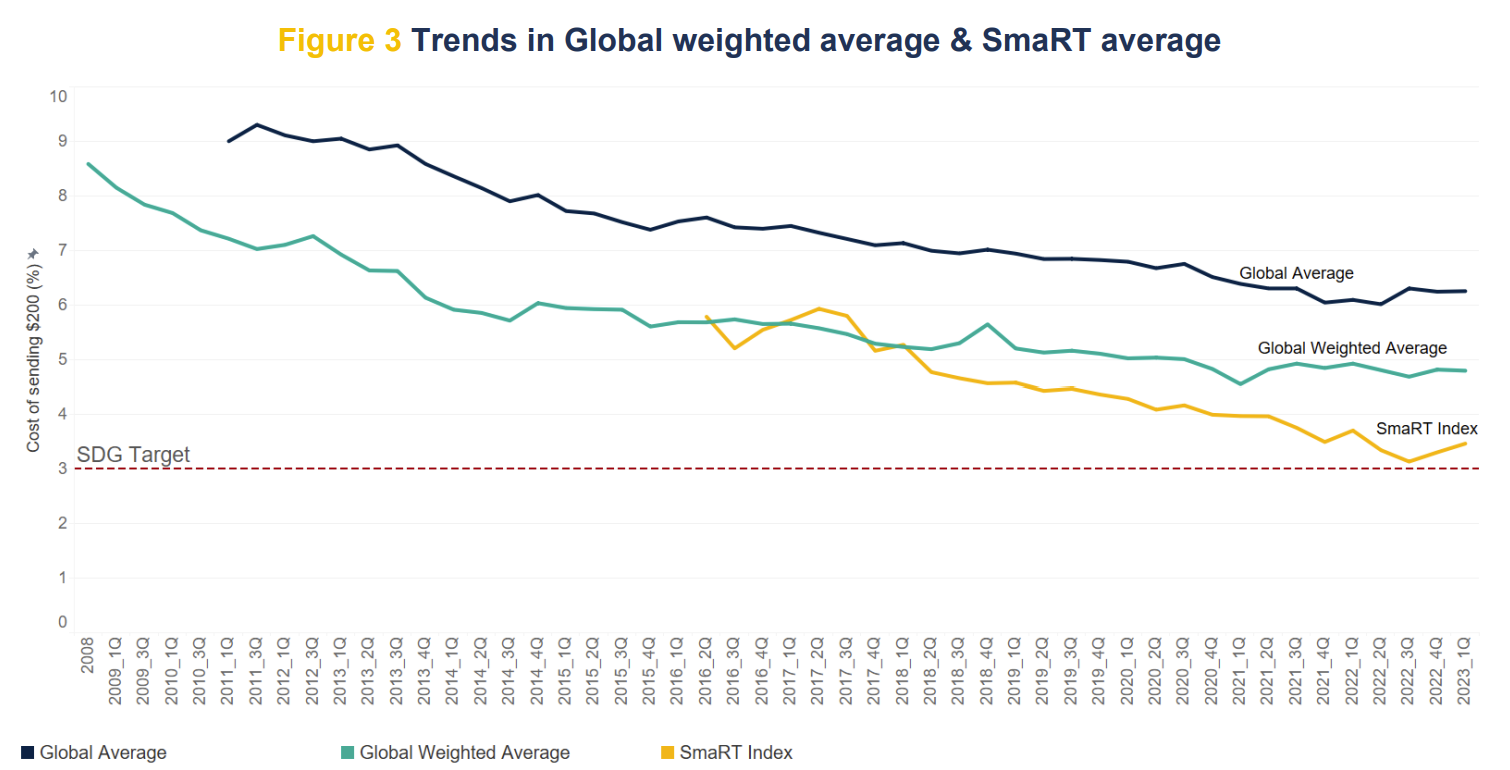
Prices for international money transfers have significantly decreased over the last three decades. In the 1990s, the average take rate (fee + FX markup) dropped from 20% to 15%. By 2010, it had fallen to less than 10%, and the best available option (SmaRT Index) is now less than 4%.
The average pricing from the world’s largest remittance corridors is generally similar, except in South Africa.
Half of the world’s most expensive corridors are coming from South Africa alone:
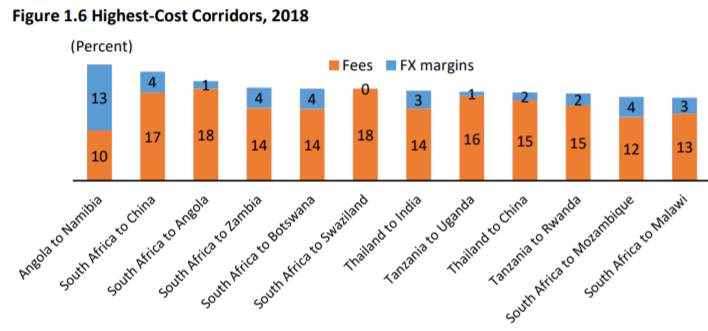
Source: World Bank
What causes South Africa to be significantly more expensive than other countries? Most experts attribute it to two factors: de-risking by banks and exclusive partnership with retailers by Western Union and MoneyGram:
“A major barrier to reducing remittance costs is de-risking by international banks, when they close the bank accounts of money transfer operators, in order to cope with the high regulatory burden aimed at reducing money laundering and financial crime. This has posed a major challenge to the provision and cost of remittance services to certain regions.”
“… the core issue with WU is their exclusivity clauses that have been used for decades to successfully lock markets to one provider, who can then increase their mark-up fees as there is no alternative.”
Neither is the case with South Africa. It’s easy to blame “banks” or “Western Union,” but the real root cause usually lies in:
- Opaque or corrupt governments with regulations favoring banks over Money Transfer Operators (MTOs).
- Incumbents who are content with their existing market share and are unwilling to compete on price.
- Consumers who don’t like shopping around for the best deals.
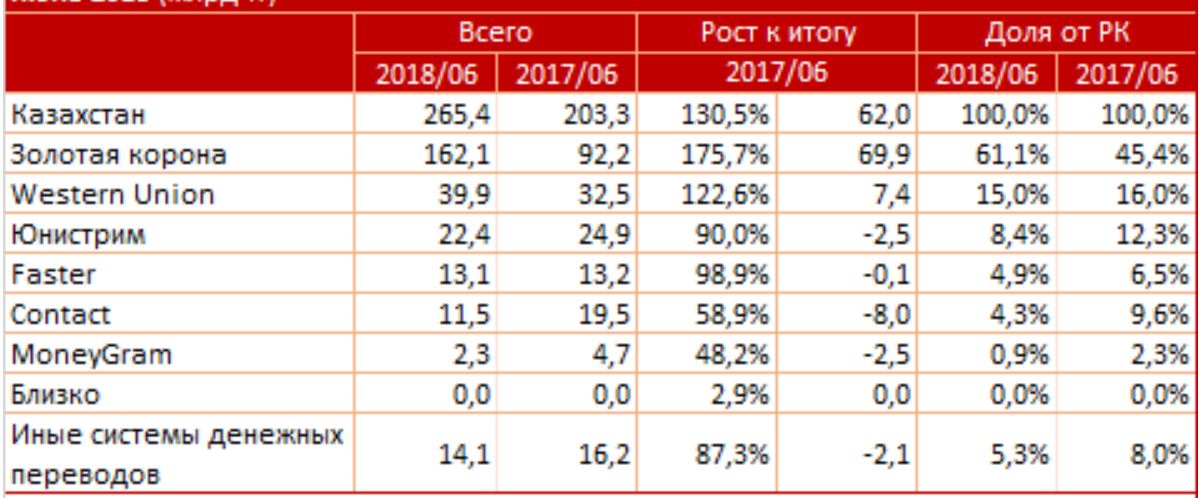
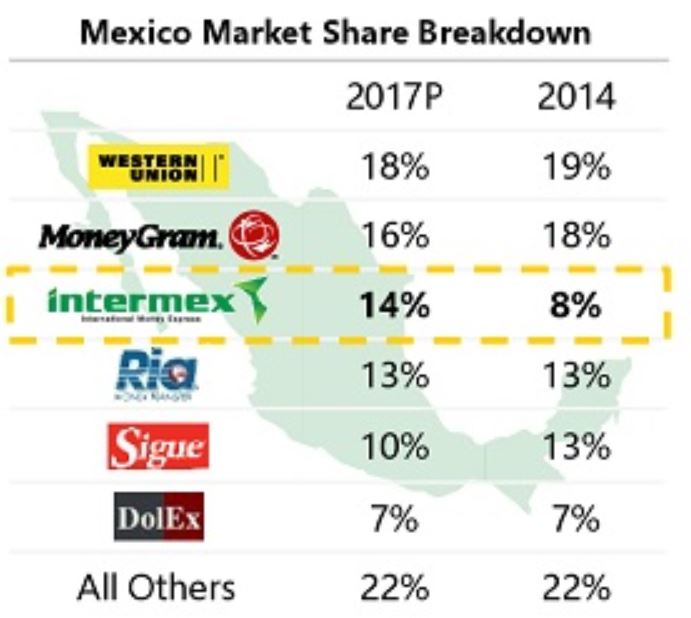
That’s why, in some countries with opposite, favorable conditions, low-priced incumbents like Golden Crown in Kazakhstan could control over 60% of the market.
Source: Kapital
Top Cross-Border Money Transfer Providers
While it might feel that Western Union and MoneyGram have been around forever, the cross-border money transfer offering outside of banks and post offices was launched less than forty years ago. In those days, consumer options were limited to slow, expensive wire services provided by banks or to physically mailing money orders. Western Union, as detailed in this in-depth SaveOnSend article, began international money transfers in the late 1980s, initially leveraging Visa and MasterCard networks. It proceeded with a rapid global expansion starting in 1989. Similarly, American Express launched a domestic money transfer service called “Moneygram” in 1988 and began international expansion in 1989.
Other current global leaders in international money transfers got their start in the following years: UAE Exchange (acquired by Wizz Financial in 2022), Ria Envia (now Ria Money Transfer, acquired by Euronet in 2007), and Golden Crown (based in Russia). Even Wells Fargo started a separate remittance business in 1994. By the late 90s, multiple providers were offering near-instant (within minutes) transfers worldwide. Remember this fact when you read another misleading article about today’s money transfers always taking days or weeks.
Today, while banks, as a class, still handle the majority of C2C x-border volumes (see this SaveOnSend article for details), they can’t match cross-border specialists regarding geographic coverage. As a result, banks are not among the top five global players:
However, within a particular market, the top banks are typically among the largest remittance providers:
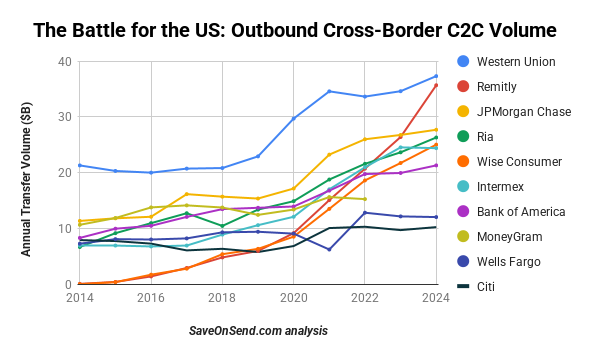
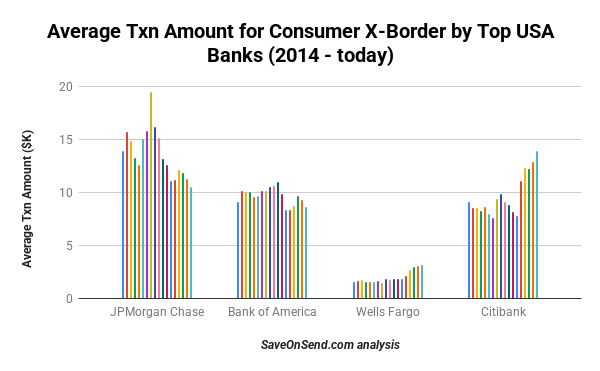
With rare exceptions, bank customers tend to be infrequent senders who transfer larger amounts (Wells Fargo is a unique story; read more in this SaveOnSend article):
Money transfer specialists continue to dominate for lower amounts, which are typical for remittances. This is especially evident in destinations with lower usage of digital channels, such as the USA-to-Mexico corridor, the world’s largest corridor:
Source: Intermex
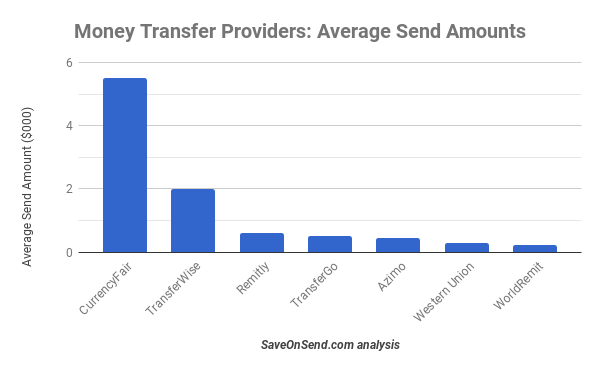
However, even among money transfer specialists, the average transfer amount can vary significantly by use case. CurrencyFair and TransferWise (Wise) primarily target expats from developed countries and tend to have average transfer amounts in the thousands of dollars. In contrast, money transfer companies targeting migrants from developing countries typically have average transfer sizes in the hundreds of dollars.
Wise, aka TransferWise, is a particularly intriguing company among money transfer specialists. Founded in 2011, its consumer cross-border volumes surpassed MoneyGram in 2018, Ria Money Transfer in 2019, and Western Union in 2022. You can find more details on all the top money transfer startups in this SaveOnSend article.
In addition to these major providers, thousands of other money transmitters specialize in specific corridors and send-receive methods, primarily utilizing cash agents. Moreover, numerous Bitcoin-based remittance startups exist, but none yield a significant transfer volume. For further insights into Bitcoin, Blockchain, and Crypto trends in remittances, see this SaveOnSend article.
Digital Trends for Cross-Border Money Transfers
There is some confusion when defining methods for sending and receiving remittances. Terms like “digital,” “online,” “mobile,” and “mobile payments” are often used interchangeably. “Digital” is an umbrella term that can encompass everything, including “online” and “mobile.” Additionally, migrants’ preferences for specific channels are strongly influenced by ethnicity, even across neighboring countries.
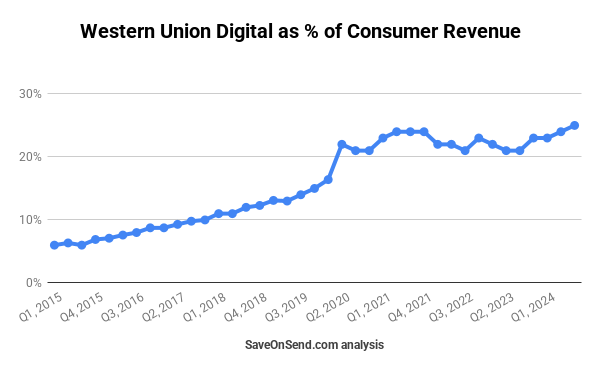
Overall, digital channels are still overshadowed by cash transactions. Despite over 70% of Western Union customers having a bank account, the digital share of consumer revenues has only grown by 1-2% annually, except for a one-time increase in 2020 due to COVID-19:
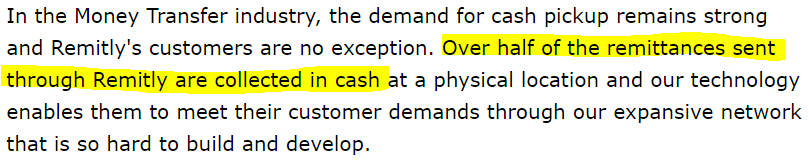
The proportion of cash remittances on the receiving end is even higher. Therefore, while Fintech startups love to discuss an imminent digital victory over cash, they continue to sign agreements with incumbents to distribute cash. For instance, Remitly partners with Ria Money Transfers, and 50% of its remittances are received in cash.
There are a few key reasons for this level of digital penetration in remittances. For one, consumers are pretty content with a cash-based offering.
A significant share of consumers in some corridors also avoid strict banking compliance to evade deportation or tax payments.
Since 2016, incumbents have sought a middle ground between cash and digital options. They introduced mobile apps that allow cash customers to enter all transfer details online and bring cash to an agent without filling out any additional paperwork. So far, there is no evidence that such efforts generate any significant adoption among their customers.
The term “mobile money” typically implies that money is paid from a customer’s account with their telecom provider. Although piloted by Western Union in 2007, mobile payments remain a small share of global remittances, primarily used for transfers to a few African countries such as Kenya and Tanzania. It took off in those countries because they didn’t have a high-quality bank card infrastructure for payments like in more developed countries. The most famous example is M-Pesa, launched in 2007 by Vodafone.
Remittance volumes in these African countries tend to be relatively small and thus outside the focus of digital expansion by incumbents or Fintech startups. As a result, mobile money could be the most cost-effective option for these corridors compared to cash-to-cash remittances.
Source: GSMA
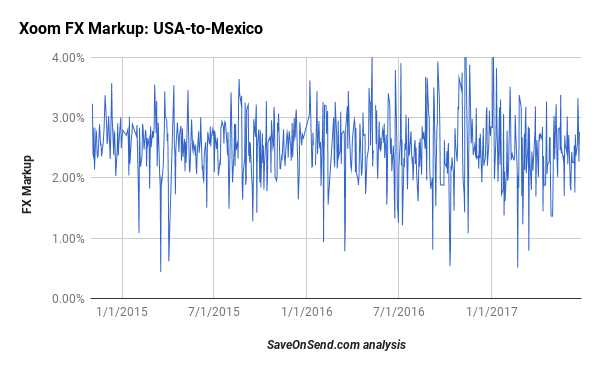
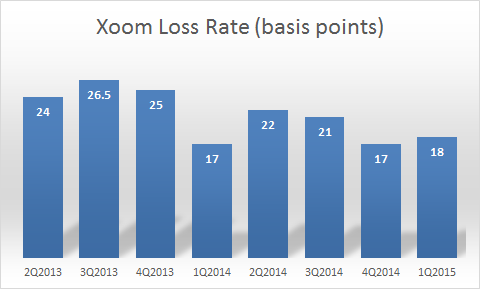
There is no real difference between “online” and “mobile.” With the arrival of smartphones in 2007, there has been steady growth in their usage for money transfers, and most digital transactions are now sent via mobile devices. For example, for MoneyGram, the ratio of mobile transactions in the online channel went from 60% in 2016 to 80% in 2019 and to 85% in 2020. For Western Union, it similarly increased from 65% in 2016 to 75+% in 2019. Here is a chart for Xoom that was ahead of the pack during 2011-2015:
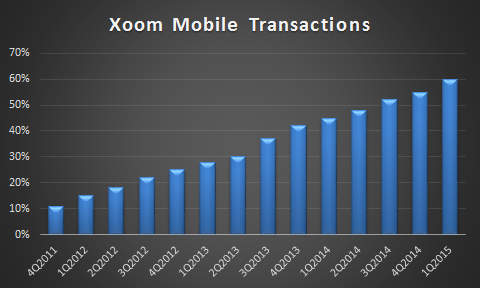
Source: Motley Fool via Xoom’s financial disclosures
Virtually all large players have a mobile application, and customer feedback is mostly positive:
There is a widely held belief, propagated by fintech influencers, that banks are losing business to new players like Wise, partly due to their lagging digital maturity, which leads to a subpar mobile experience. In reality, between 2021 and 2023, bank mobile app usage for remittances grew the most compared to wallet and money transfer apps, making it the most used app among these three groups:

Users of International Money Transfers
The reasons why migrants send money vary significantly by corridor and sub-segments within it. For instance, in early 2017, Remitly surveyed its customers and found the following distribution of reasons:
- 70% send money to help their families with basic needs, including housing, food, and utilities
- 16% send money to cover their personal expenses and investments
- 11% send money to help pay for education costs such as school supplies, books, and tuition
- 3% send money to help pay for medical and emergency expenses
As we reviewed in the article on Western Union, the same provider could adopt vastly different approaches when targeting different migrant groups. The reason behind this is that each migrant group is unique. For example, consider this graph that compares income and education by ethnicity in the US, and try to guess which group is more likely to send money online:
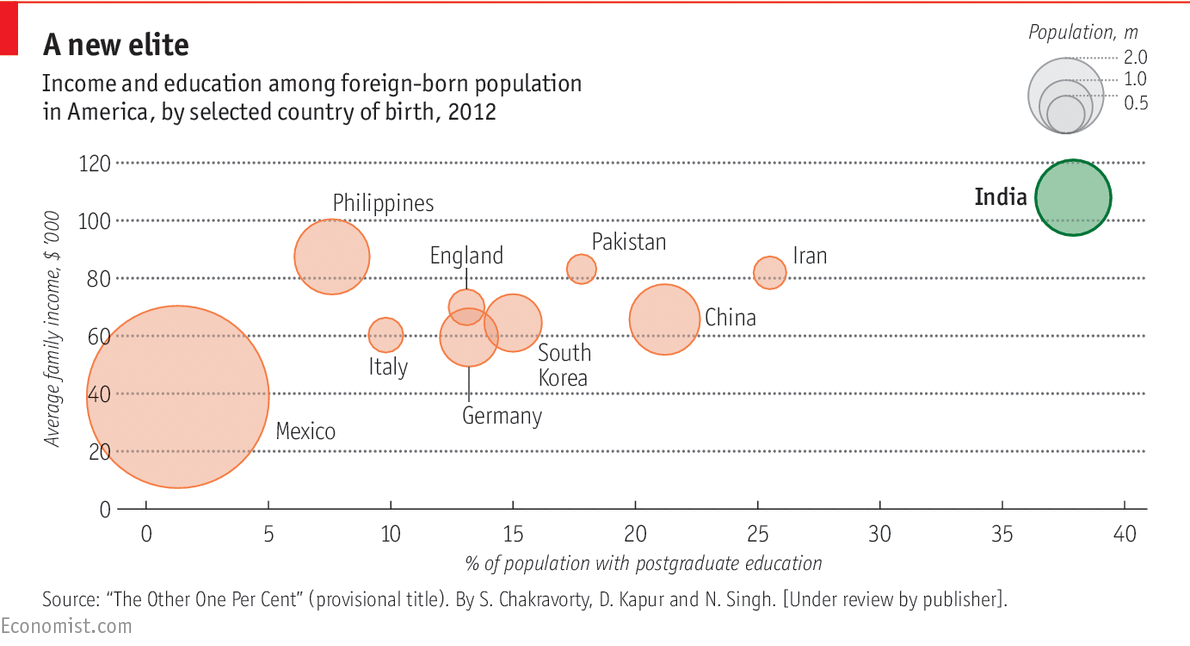
More educated consumers are more likely to send money online for a few primary reasons: they tend to be more digitally savvy, are more open to trying a new provider, and receive taxable income in their bank account. Therefore, over 80% of remittances from the US to India are sent online, whereas less than 40% are for the USA-Mexico corridor.
The reverse relationship is also true: online senders tend to have higher incomes. Even within the same ethnic group, the average amount sent online could be 50-200% higher than via a cash agent. The higher-income consumer segments also have different reasons for sending money home. Low-income migrants typically transfer smaller amounts ($200-300) monthly to cover the basic needs of their families back home or for emergencies. Conversely, higher-income people send more money ($1,000-2,000) less frequently, either to their savings accounts back home, as a gift, or for emergencies.
There are also cultural differences among migrant groups. For instance, Indians in the US typically exhibit high price sensitivity as consumers. They are more inclined than others to seek the best deal through comparison applications and are more prone to switching providers to minimize fees or secure a more favorable exchange rate. Conversely, Mexicans or Filipinos tend to be less price-sensitive and more loyal to their current service providers.
Finally, even within the same migrant group and income level, there are behavioral preferences. Some individuals may pay extra for an immediate money transfer, while others will wait a few days to secure the best exchange rate. These factors, along with many others, have direct implications for providers regarding how to market and price their services, ultimately influencing their revenue streams.
Business Models
Most of the prominent cross-border money transfer providers cater to three types of clients/customers:
- Consumers: the primary focus of SaveOnSend articles.
- Businesses: typically smaller businesses that are comfortable with digital self-service.
- Competitors (Platform): offer money transfers but prefer to use a core platform from a more digitally advanced provider.
SaveOnSend primarily focuses on the Consumer segment and doesn’t delve into the Business and Platform segments in great detail. It’s worth noting that the Business segment typically generates smaller revenues than the Consumer segment among money transfer specialists, and the Platform segment is even smaller. For example, Wise breaks down its Consumer and Business segments, with the Platform business accounting for 5% of overall volume in 2025.
Providers typically generate revenue through fees and foreign exchange (FX) markup in the Consumer segment. The FX markup involves a customer’s money being exchanged at a less favorable rate than what providers can obtain. Depending on the sending and receiving methods, and even on a specific transfer corridor, the same provider might charge no fees and rely solely on an FX markup. For instance, Intermex generates less than 20% of its revenues from FX markup:
Some providers, such as Wise, are renowned for charging no fees and profiting solely from the FX markup.
Wise, indeed, operates with the lowest margins.
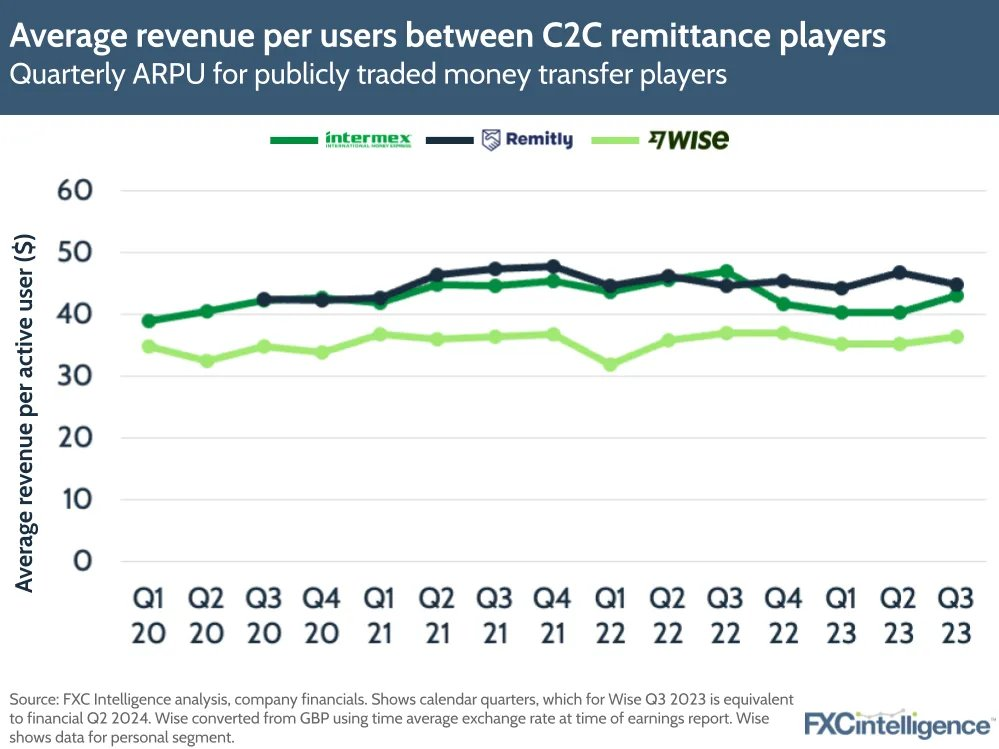
Wise could do this profitably because its average transfer amount is much higher, driven by the types of customers and use cases we mentioned earlier. That is how Wise can generate about the same revenue per user as remittance specialists with smaller transfer amounts:
All well-known providers cover multiple outbound countries and even more inbound destinations. Providers usually derive more volume from the country of their origin than from other markets where they expand later. Here is an example with Remitly, which was founded in the US.
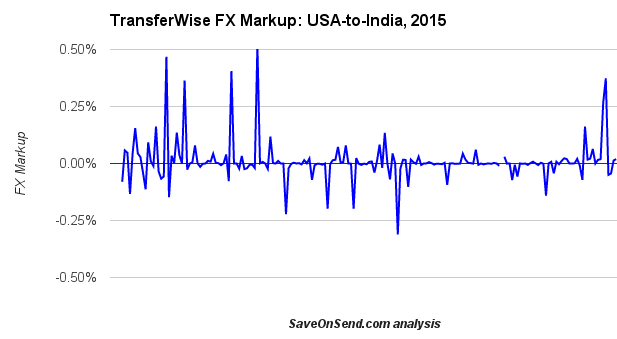
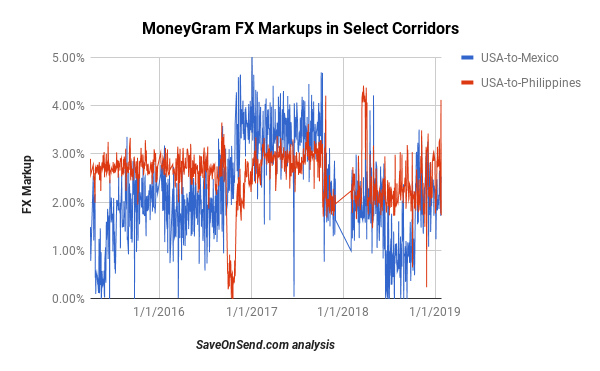
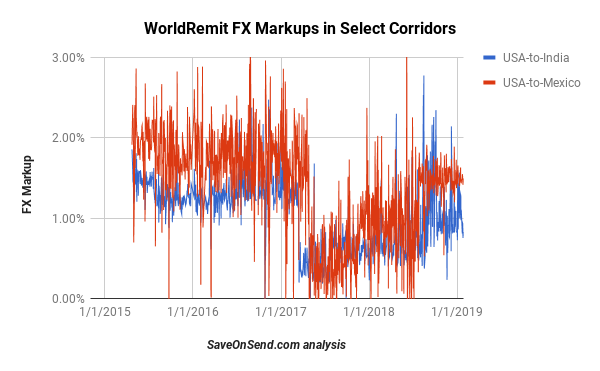
While fees tend to change infrequently, some providers adjust FX markup dynamically with significant swings:
Some providers also run temporary pricing promotions, significantly lowering FX markup for a few weeks or even charging no markup, to grow market share in a particular corridor rapidly.
Established companies like Western Union and MoneyGram used to charge a higher average markup, partly driven by stronger brand recognition and by supporting more sub-scale corridors. However, in the last decade, that brand markup has become negligible. As was already discussed, one pricing exception is Wise, whose business model explicitly involves lowering prices to disrupt banks and specialists.
Finally, money transfer providers usually charge markups that vary with the corridor’s cost structure, the type of transfer, and customer behavior. For example, as Western Union acknowledged in 2020, some ethnicities tend to be more price-sensitive and more likely to switch providers, so they usually get a smaller markup.
This drives some providers even to offer negative FX, i.e., lose money with hyper-price-sensitive customers in large corridors like sending money to India from the US or UK, as MoneyGram acknowledged in 2019:


So why are there so many fact-free articles, partly pushed by fintechs, claiming that incumbent specialist providers and banks are expensive? Such misleading commentary (see more in this SaveOnSend article) conveniently compares “apples and oranges”: startups’ margins for sending large amounts online vs. what incumbents charge for sending small amounts via cash agents.
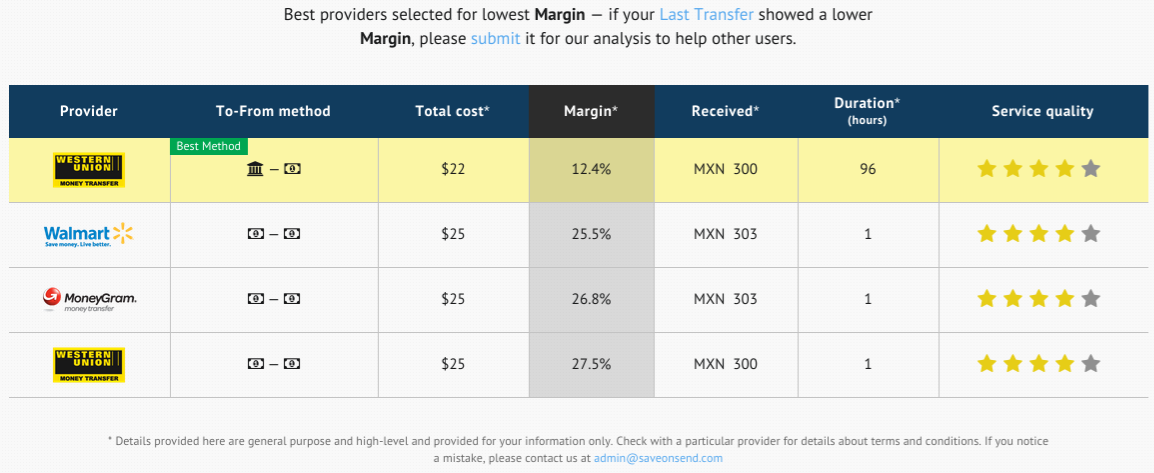
If a reporter were biased against incumbents, it would be easy to feel self-righteous by cherry-picking fees from Western Union and MoneyGram for certain transfers. Just look at how much they charge for sending $20 via a cash agent from the USA to Mexico: almost 30%!
While it is easy to talk about helping the “poor,” it is actually quite expensive to set up a cash-agent network that will remain, likely for decades, a predominant method of sending money among migrants. Moreover, we know that very few consumers send such small amounts, and many do it knowing they could save by a) sending more and b) switching from cash agents to digital sending methods.
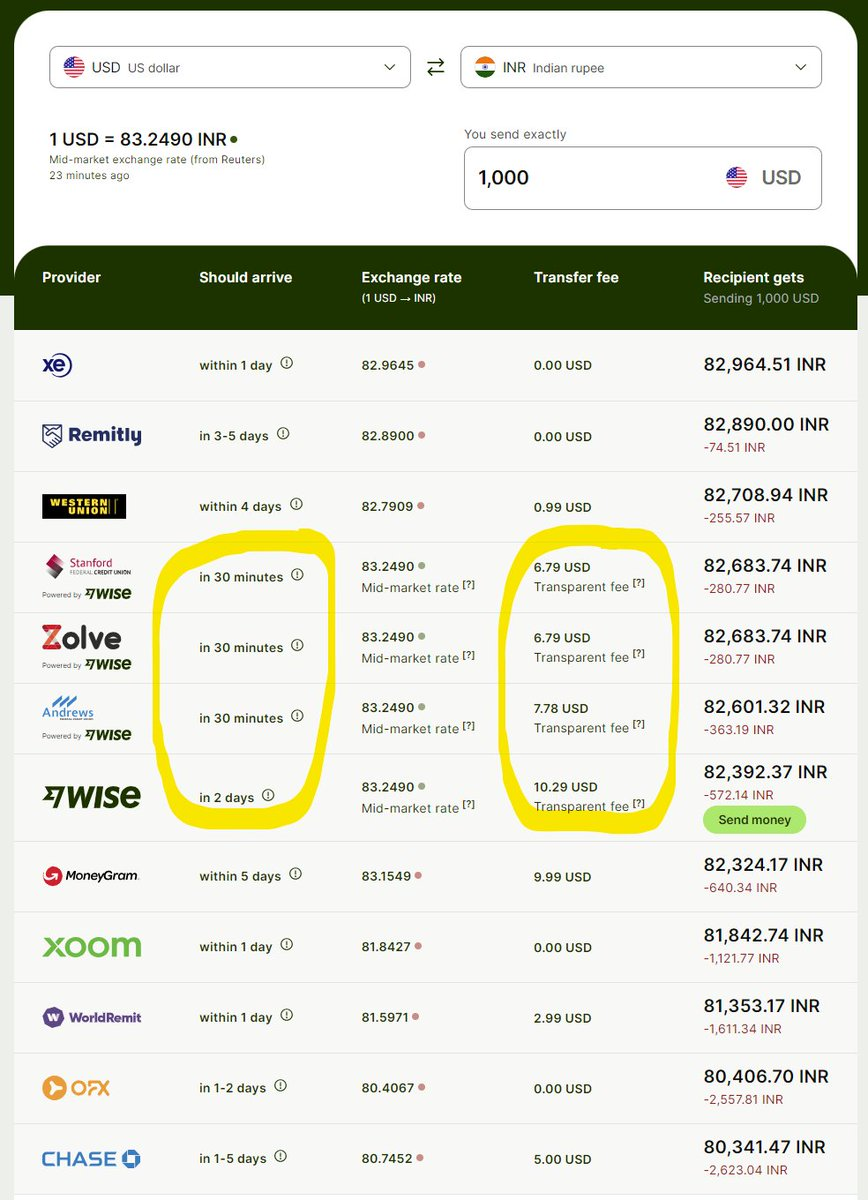
So how do “old” and “new” providers compare for a typical transfer amount when sent digitally? Here is a global poster child, ground zero of online consumer remittances, the USA-to-India corridor, unique due to its highly educated senders who tend to switch providers for a better price:
While Wise tends to be the least expensive provider, its business model has been predicated mostly on referrals with little marketing spend. Unfortunately, many consumers don’t seem to care whether they pay 0.5% or 2.5%, and those who do are seeing lower prices from Wise’s competitors, as seen in transfers to India. As a result, Wise’s consumer volume growth rate has stagnated at around 20%, which might compel Wise to invest in regular marketing and incentives.
On the other extreme, Remitly is still growing at around 40%, but it spends 20-25% of revenue (5X that of Wise) on marketing, which has kept it unprofitable for over a decade since launch.
Variable and Fixed Costs
On the cost side, as you remember from financial statements, variable costs are associated with each transaction and overall fixed costs.
Variable costs include many standard components specific to each transaction and account for 30-50% of all expenses, depending on the provider. They are broadly divided into the costs providers pay to receive funds and to discharge money.
Receiving funds: Money transmitters pay agent networks to collect cash transfers and pay banks for sending money from a customer’s bank account or a linked debit/credit card. Banks charge relatively little for transfers from their customers’ accounts, approximately ~30 cents, as it is facilitated through the FedACH Service with nominal fees (see “origination per item” in the table below):
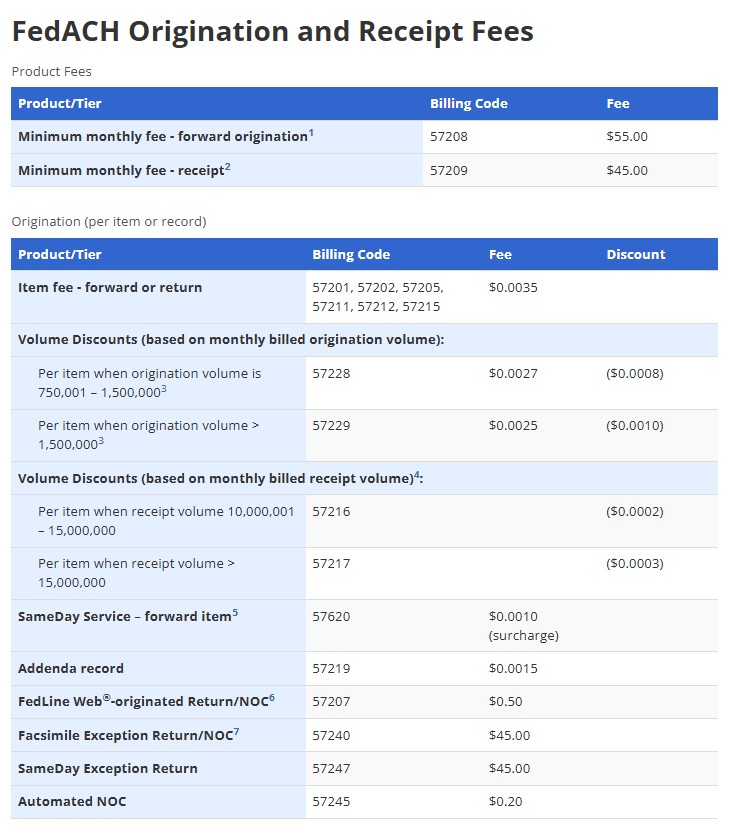
Source: Fed
For bank-funded transfers, fees are usually fixed across broad ranges of amounts (e.g., the same cost for sending $0-1,000 or even $0-2,999).
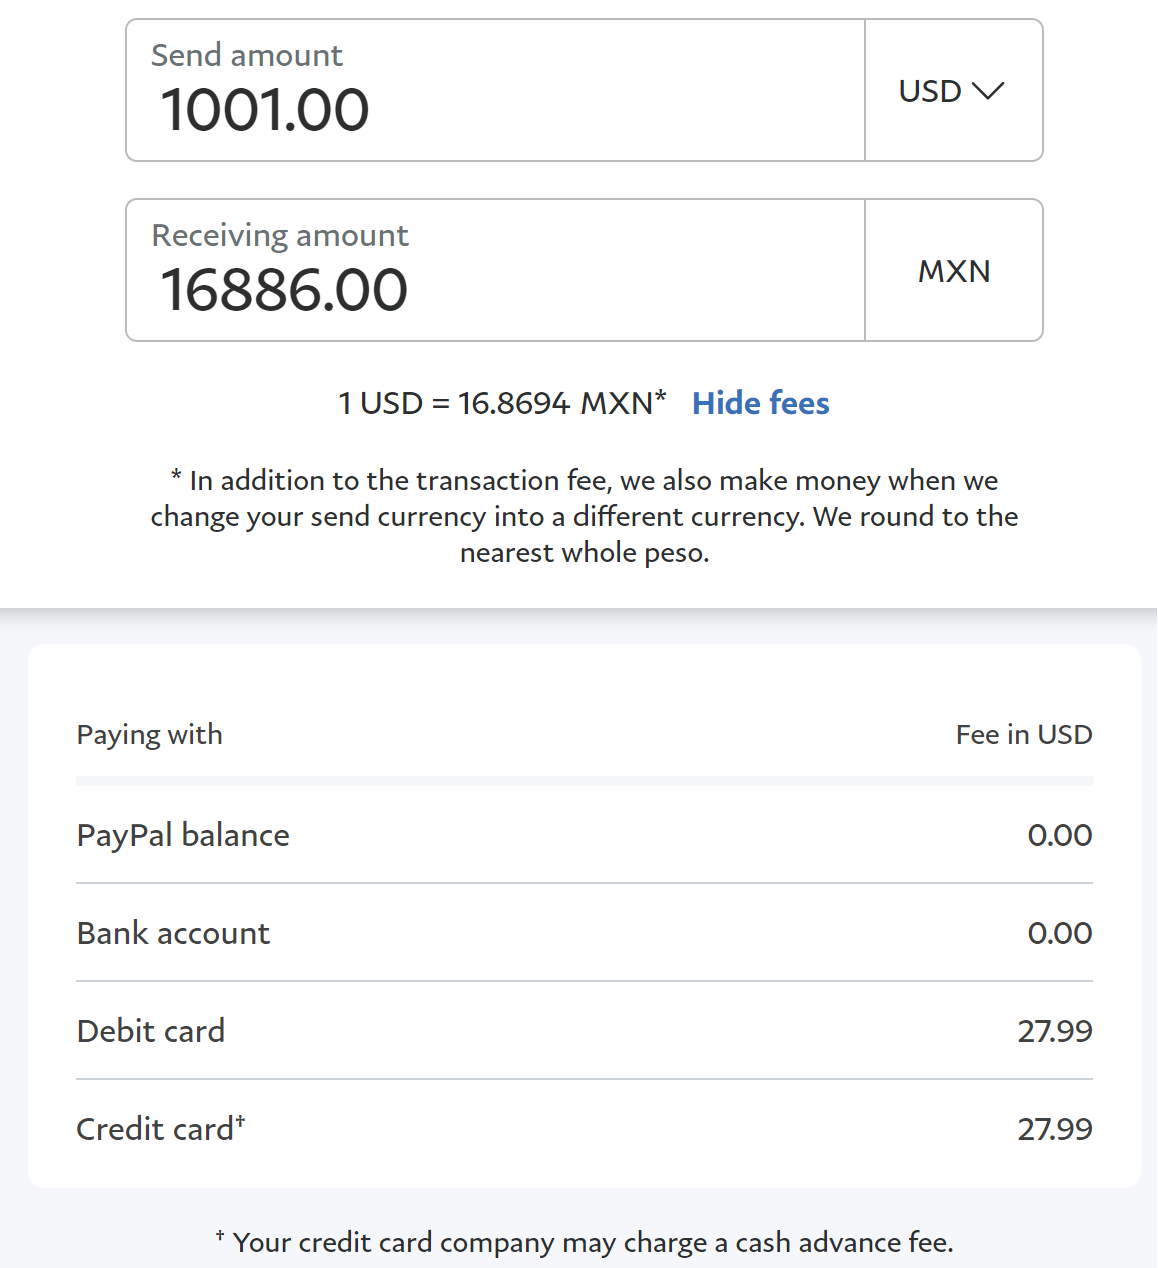
Card funding payment is usually variable, typically 1-2% of the transfer amount. That’s why consumers who want to use a debit or credit card to fund their transfers generally are charged a much higher fee.
For example, Xoom charges a flat fee of around $4 for sending less than $1,000 from the US to Mexico. Still, its price for card transfers skyrockets for larger amounts (a credit card funding method is the most expensive for consumers because, on top of the high fees charged by a money transfer provider, there is a cash advance fee from a credit card company):
Some money transmitters use the so-called “on-us” technique to minimize card-based funding costs. They accomplish this by applying to process debit-credit card transfers in agent locations. In a sense, they are closing a loop by sending money from a linked debit-credit card and processing such transfers internally without leveraging Visa/MasterCard/etc. networks. networks.
Payment to cash agents is much more nuanced and covers both fees and FX markup. Negotiated terms could involve a split of those or a minimum threshold a provider must receive, while allowing an agent to markup fees and exchange rates at its discretion. Depending on the provider, retail chain, and market, revenues are split between these two parties in a vastly different way.
For example, a market leader like Western Union could be more selective, only paying 10-30% of collected fees to a cash agent. A smaller provider might split fees 50/50, and in some cases, when a money transmitter wants to gain market share quickly, it might offer additional incentives to cash agent networks by promising to pay them up to 100% of collected fees. There is a similar logic when splitting an FX markup. Conversely, a larger retail chain could negotiate better terms than a smaller one.
Discharging funds: Providers pay banks and cash agent networks to discharge money or provide cash to customers. These payments are usually fixed; for example, a provider might pay $2 per transaction to a bank in a destination country.
Large players built direct relationships/connections with large banks and cash networks for both the receiving and discharging processes. These providers would send funds to a correspondent bank for each destination daily. For example, if Western Union transfers $10 million daily to Mexico on behalf of its customers, it would send that amount to its correspondent bank in the US (in dollars) so that the bank could distribute funds in Mexico.
Since an exchange rate can move significantly during the day, some providers would also have an in-house hedging-trading desk staffed with a few people responsible for buying and selling currencies to minimize exchange rate exposure. Such daily wires for each destination, plus a trading staff, seem like a significant expenditure, but in the context of million-dollar volumes ($30 wire for $1M daily volume with a 3% average gross margin represents 0.1% of revenues).
That is why the blockchain-Bitcoin-crypto method of money transfer, while theoretically eliminating the need for wire transfers, is saving relatively little and actually adding higher additional costs due to extra currency conversions and much higher volatility (for more details on blockchain, Bitcoin, and crypto for remittances, read this SaveOnSend article):
Blockchain aside, money transmitters have been deploying their transfer services via intermediaries for some or all markets. In some cases, Xoom used Earthport, Wise – Earthport, WorldRemit – Earthport and BTS, Azimo – CurrencyCloud, and Viamericas (aka, Vianex) – Earthport. There are also regional intermediaries, such as Wise’s partnership with Flutterwave in Nigeria. Such an approach is easier and faster but might be more expensive in the long run. For example, CurrencyCloud was charging around 0.1% of transfer volume for its services (see the full report here):

Using such an intermediary also increases the risk of dependency on a single provider for the most critical element of back-office processes: transferring funds across entities.
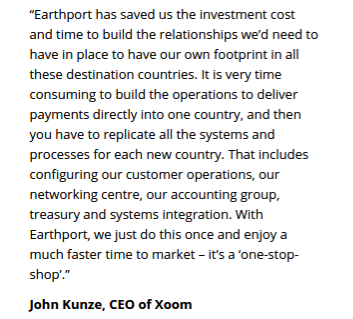
Xoom – Earthport Partnership: Description of benefits by Xoom’s CEO
Besides intermediaries, fintech startups could also partner with banks or even with direct competitors among incumbents to get faster access to distribution. For example, in December 2016, WorldRemit signed an agreement with Xpress Money (read more here):
“We want to offer our customers the widest and most convenient choice of payout options. Xpress Money is a trusted and dependable money transfer brand with a fantastic network of agents across the world. Our partnership will extend our footprint into new territories and will enable even more people to make secure, instant money transfers.”
Fixed costs are not specific to each transaction and encompass spending on technology components, including software and hardware.
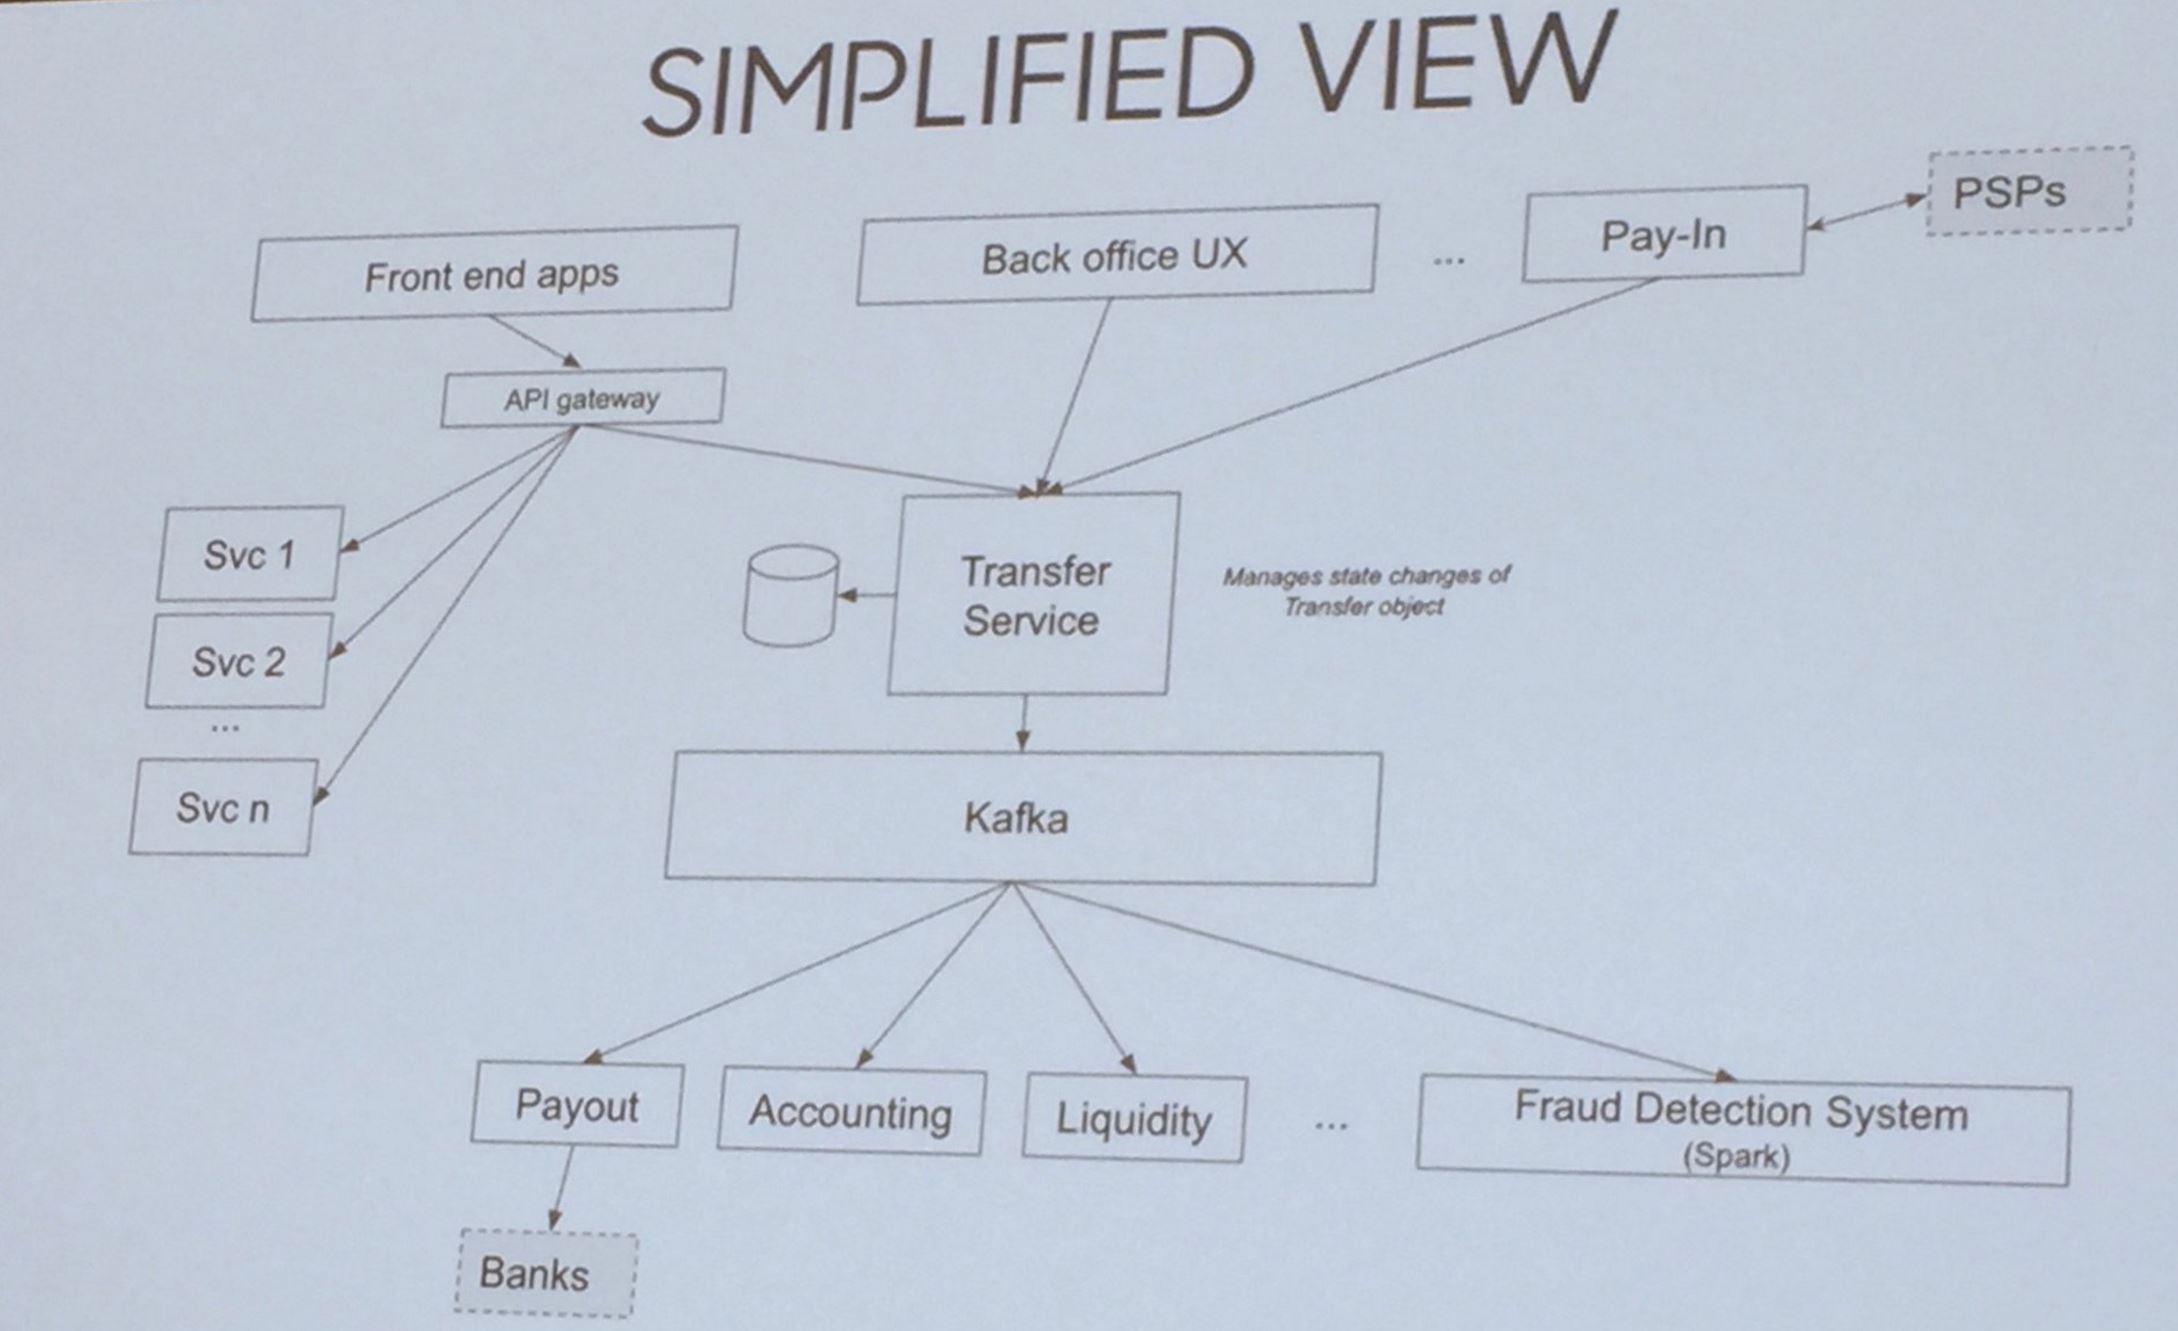
Example of Systems Architecture: TransferWise, September 2016
Fintechs’ architecture tends to be simpler than that of incumbents as they acquire fewer companies with legacy systems. It takes them the first 5-10 years to develop it, with IT expenses sometimes reaching 30% of revenues. However, afterward, the fixed cost of well-architected platforms could scale to much higher transaction volumes, resulting in 15-25% of revenue spent.
- Licenses are required to operate in the US in a state where a money transmitter conducts business. Getting licensed is time-consuming and expensive, followed by a thorough annual audit examining all aspects of operations, including cybersecurity. That’s why you see fintechs like WorldRemit starting in 2015 with just a few, typically more minor, US states where it is easier to get licensed and then working their way up to the largest states over many months, if not years. Others, like TransferWise, entered the USA in 2015 by partnering with a licensed provider like PreCash (it later switched to CFSB):
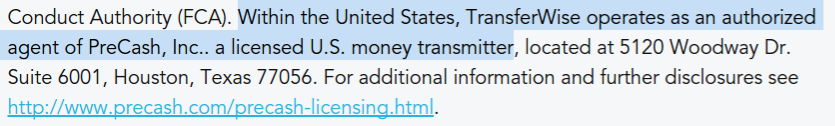
TransferWise – Pre-Cash partnership: T&C, May 3, 2015
- Fraud:
- “NSF” (Not Sufficient Funds) occurs when a customer sends money from a linked bank account or card without having those funds.
- “Misrepresentation” is when a customer lies about NOT sending money after the transfer is completed (according to US laws, a customer has up to 12 months to dispute a transfer).
- “Account takeover” is when a customer’s account is compromised.
Here is how the fraud economics work for a $1,000 money transfer from a provider’s perspective:
- The average revenue per such transaction is $30, and the profit is $5.
- So, a remittance provider needs 200 successful transfers to compensate for one fraudulent transaction (to compensate for losing $1,000 to fraud)—break-even is 0.5% of transactions due to fraud.
- The overall number of fraud attempts across various migrant groups ranges from 1% to 5%, exceeding the 0.5% break-even point.
- Money transmitters employ various techniques to keep actual fraud rates much lower, near 0.1%. In the 2017 FTC lawsuit against Western Union, the company’s complaints database included around 50 thousand fraud-related complaints per year, around 0.02% of around 250 million transactions per year. The firm estimated that the actual number is likely five times higher (0.1%) due to under-reporting.
Source: Motley Fool via Xoom’s financial disclosures
The fight against fraud is constantly evolving as fraudsters become increasingly sophisticated. Some providers have excellent fraud-prevention teams with deep statistical backgrounds, but still get ripped off.
- Cybersecurity: Similar to fraud, preventing hacker attacks is becoming increasingly challenging yet imperative given the high potential costs (see Xoom’s December 2014 debacle).
- Compliance: In addition to implementing the above control-related processes, remittance providers must demonstrate that those processes operate effectively.
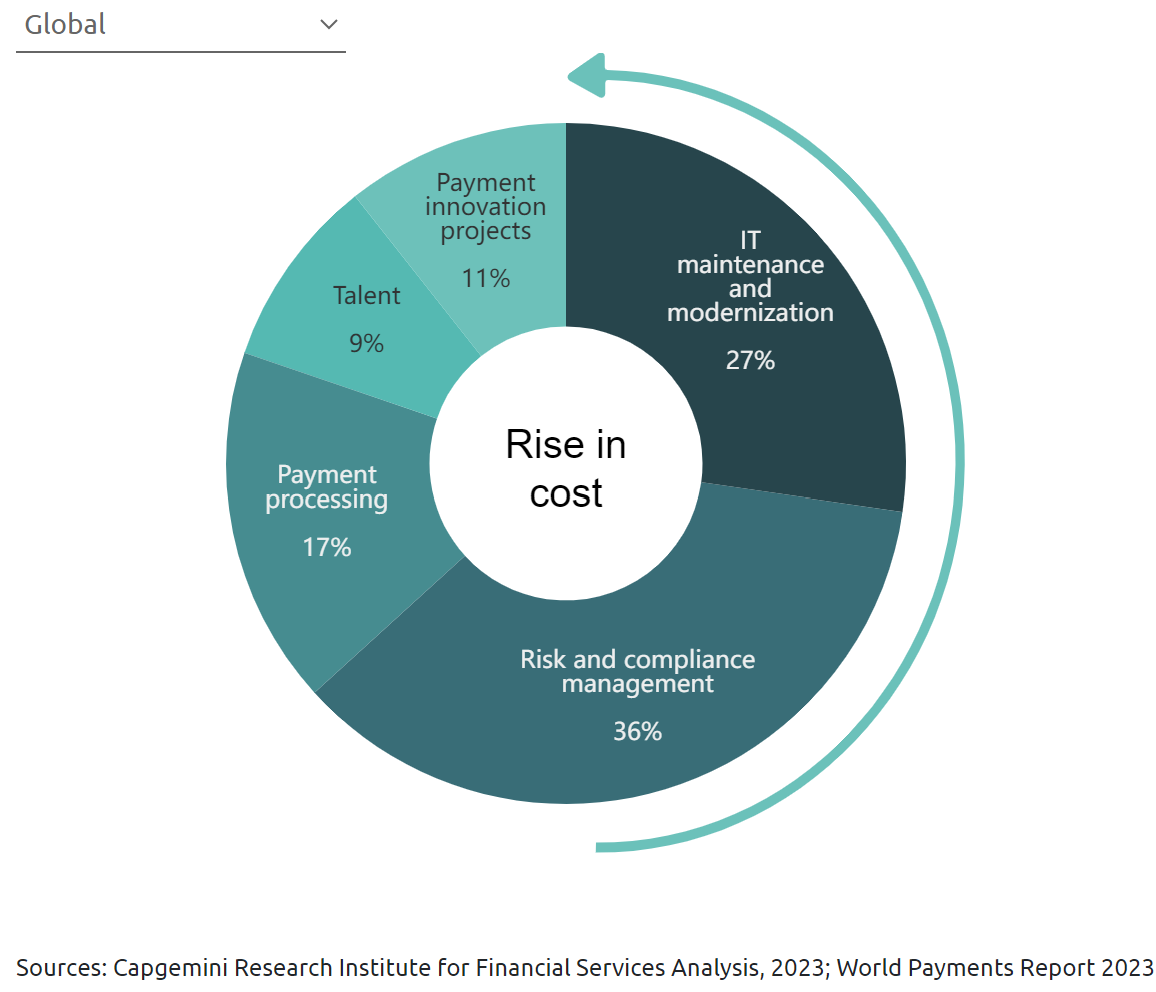
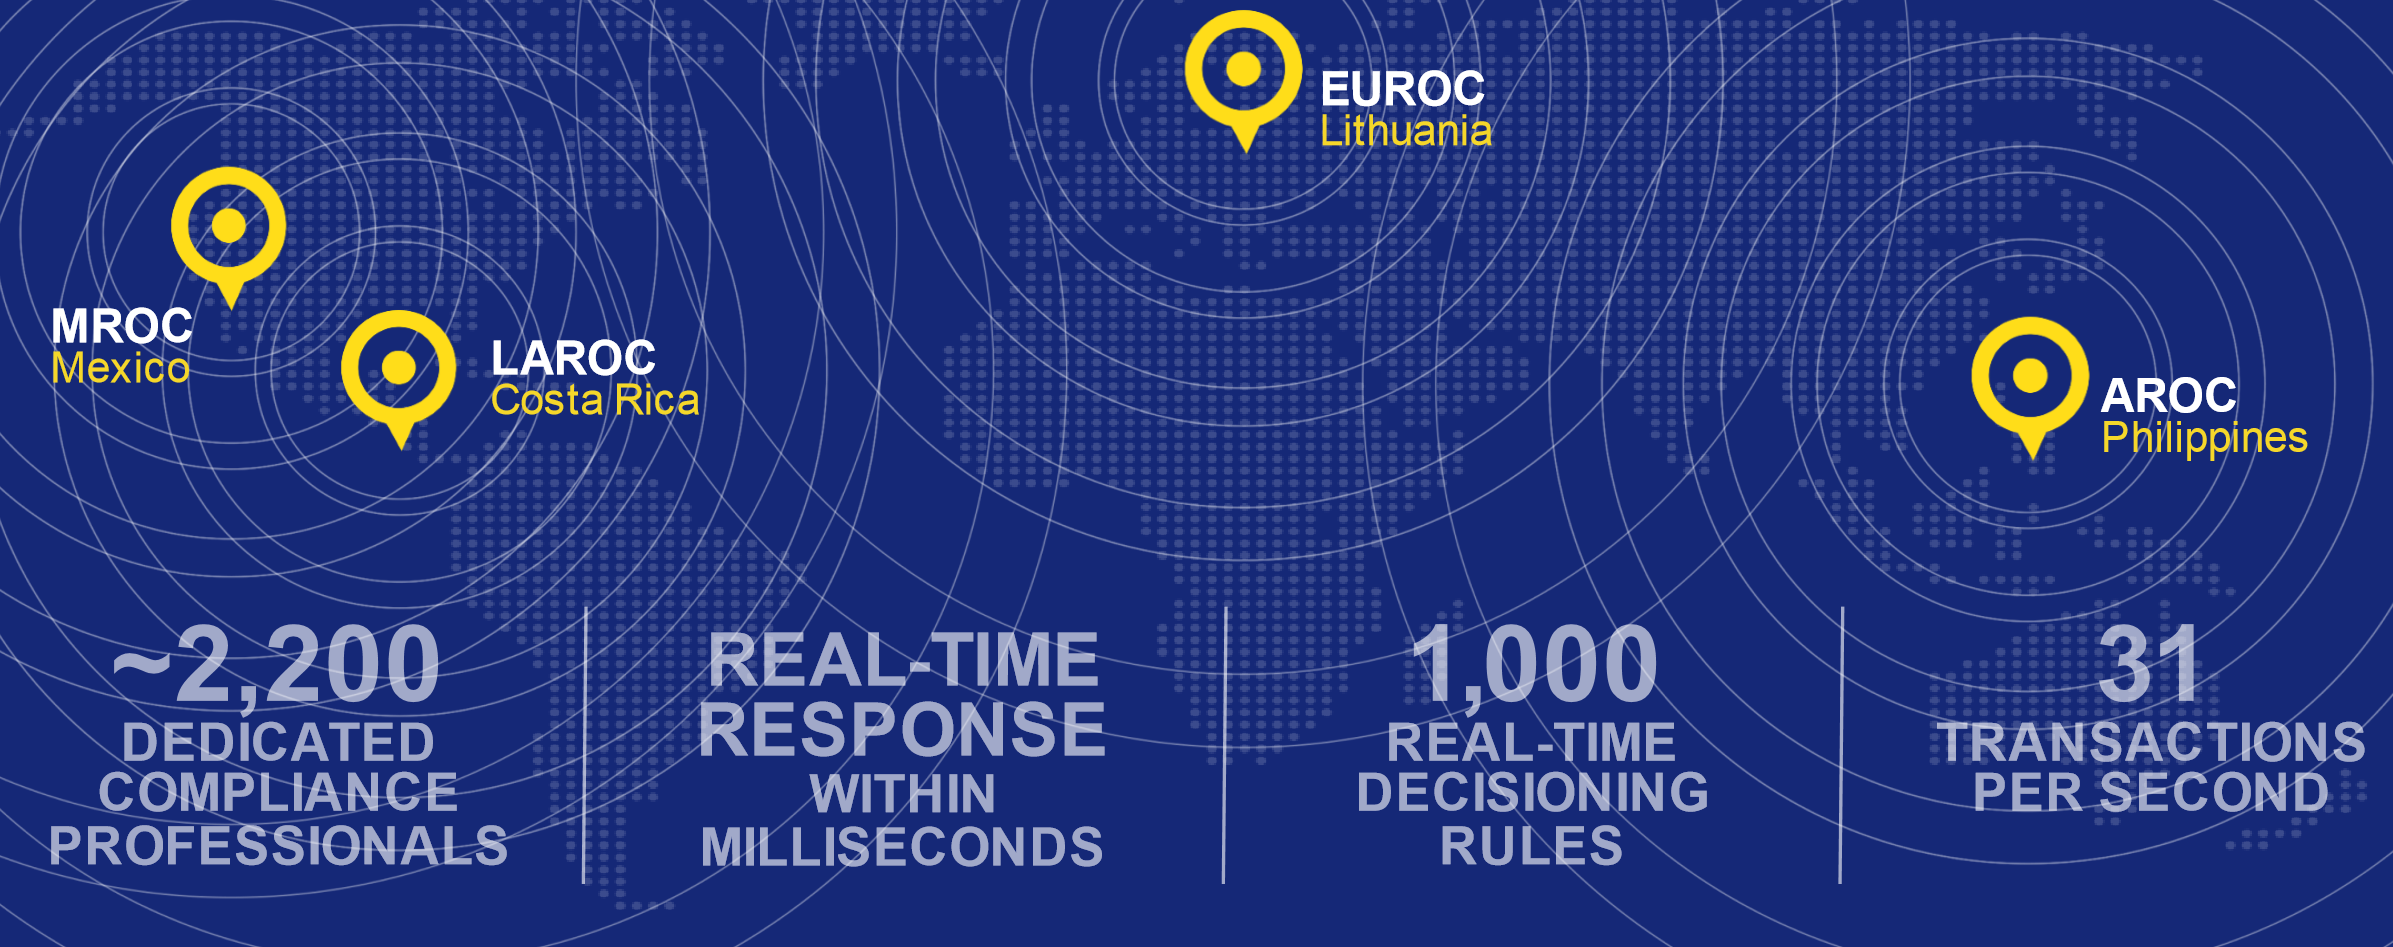
Compliance-related capabilities are costly. It costs Western Union $200 million annually and involves 2200 employees or more than 20% dedicated to compliance. Across the Payments industry, risk and compliance management accounted for 36% of the total costs, making it the largest spending category:
Due to opaque regulations and sporadic enforcement, money transfer providers rely heavily on manual labor to impress regulators and demonstrate that they take compliance seriously. There is little actual crime stopping because the government is not incentivized to reduce financial crimes, as those funds could potentially enrich other developed countries. Hence, providers check the necessary boxes to avoid fines, and, in many cases, investigations occur only when requested by law enforcement agencies.
Even the best fintechs seem to have given up on further scaling this function. In early 2025, 15% of the available roles at Wise were in Financial Crime:

Compliance rules can vary by country, making them hard to follow, especially since most local partners are independent organizations. Imagine ensuring that all employees of all your agent partner locations (500,000+ for Western Union) strictly adhere to compliance procedures.
So despite such massive and ongoing spending in this area, Western Union was hit with a $568 million fine in the US and ~$2M fine by Ireland’s Central Bank, MoneyGram paid $13M in fines in the USA and two back-to-back fines, $0.4M in total, to The Australian Transaction Reports and Analysis Centre. Incumbents often feel that they have been disproportionately singled out for such compliance enforcement. It might be accurate, but it doesn’t mean that other established providers or fintechs don’t take compliance seriously.

Money Transfer Costs: Compliance, CEO of remittance provider to Africa, May 5, 2015
Acquisition Channels
All providers use the same channels for acquiring customers: Paid Search, SEO, PR, Billboards, online-TV-radio-print advertisements, Affiliate Marketing, Social media, Referrals, and Promotions. The apparent objective is to keep customer acquisition costs as low as possible. Among established providers, the cost could range from $10 to $ 100 per customer, depending on acquisition capabilities, channels, corridor, and segment, among other factors.
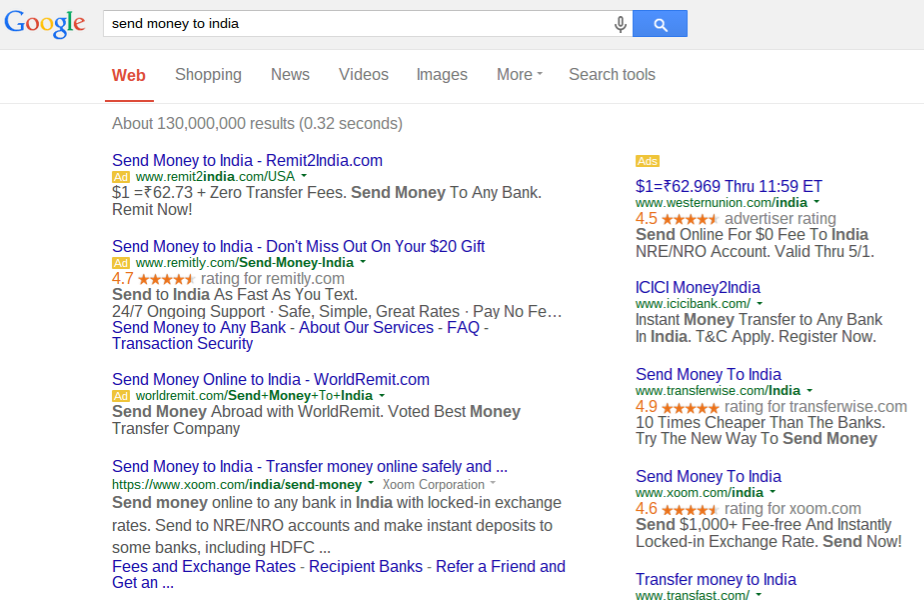
Paid Search: A money transfer provider pays a search engine like Google for an advertisement at the top of the search page. The closer it is to the upper left corner, the more it costs.
Source: RemitRadar
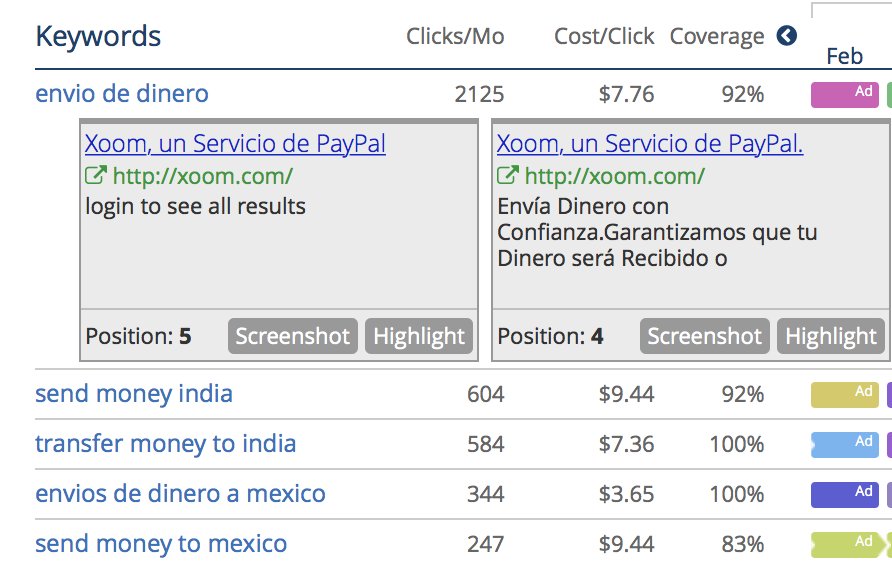
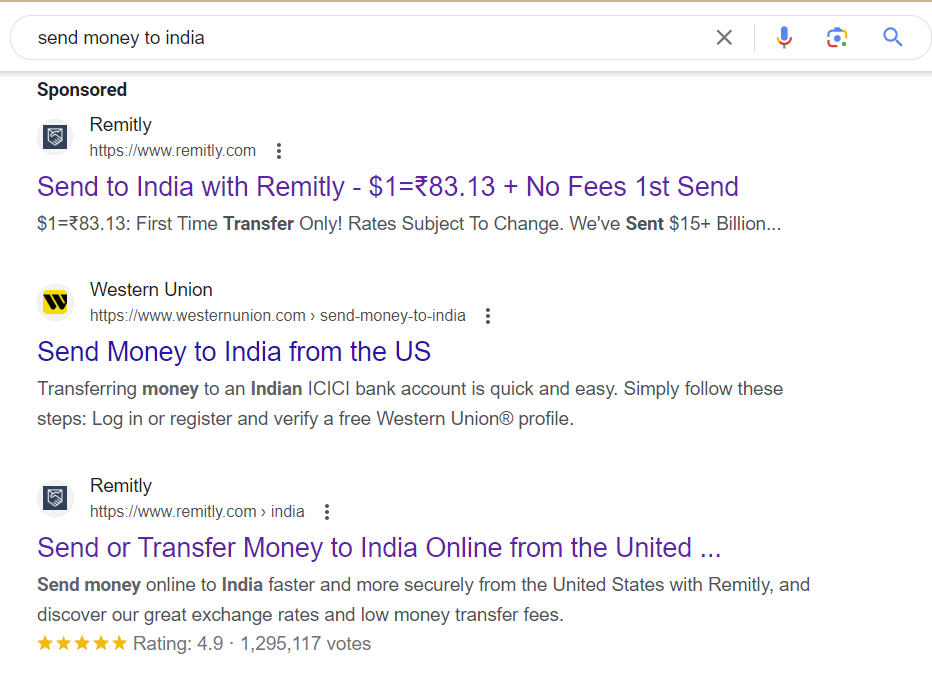
SEO: The goal is to rank as high as possible when customers search online for money transfer options. In the image below, Xoom has both the top SEO result and a paid ad in the right column.
Money Transfer: Customer Acquisition, SEO vs. Ads, May 2, 2015
Paid search allows for more specific wording, while SEO captures a more general page title. Compare both the sponsored and organic results for Remitly:
PR: The goal is to get favorable mentions in the media that look like legitimate reporting. By definition, an outsider should never know whether a particular article was “sponsored” or not. For example, read this article, which roots for TransferWise: Richard Branson and Peter Thiel aim for Western Union. As you can see, it is tough to draw the line between lazy reporting and a great PR job (best described by Paul Graham’s classic “The Submarine”).
There are various ways to arrange PR publications. Sometimes, a publisher overtly quotes a price, e.g., “$100K for four positive articles.” A remittance company often hires a PR firm that deals with a publisher. In the SaveOnSend analysis of remittance articles, most seem to be written under quid pro quo. Such articles or interviews never ask tough questions or follow up for clarification.
If you come across legitimate quality reporting on consumer remittances, please leave a link in the comments section. Unfortunately for consumers, this trend is likely to expand, as brilliantly noted by John Oliver:
Billboards: self-explanatory (see example below)
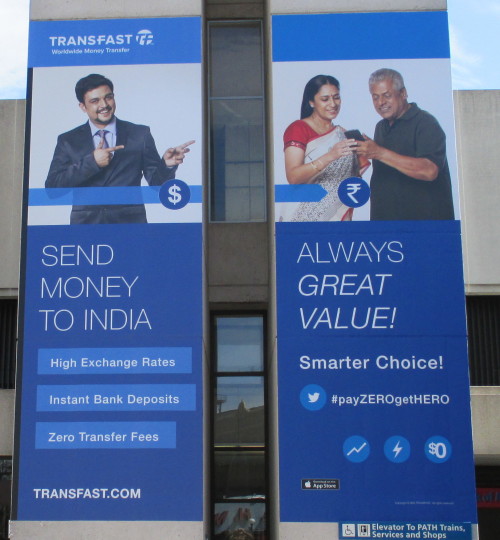
Transfast: Billboard, New Jersey, April 2015
TV Ads: also self-explanatory (see a typical theme in this ad for WorldRemit).
Affiliate Marketing: The goal is to acquire customers through popular websites frequented by senders. When users click a link on such a website, they are redirected to a money transfer provider. For smaller websites, a remittance company would pay a fixed amount (e.g., $1- $ 10 per new customer) and use an aggregator. Large websites could negotiate customized terms and work directly with providers.
Social: This channel allows remittance companies to promote their brand and services on social media platforms (Facebook, Twitter, Instagram, etc.). Each provider takes a unique approach to balancing those two components.

Money Transfer Acquisition Channels: Social, Western Union, Facebook, May 2, 2015
Fintechs typically target a 12-month payback across acquisition channels. To accomplish this, Wise relies on extensive testing and analytics:
“… we use a load of different sources of data, Lift Tests, Brand Lift, Facebook’s pixel data, our own data and attribution as well as some 3rd party data.”
Referrals: The goal is to motivate existing customers to act as sales agents for a provider.

Money Transfer Acquisition Channels: Referral, Western Union, May 3, 2015
Popularized by Uber and leveraged for selling many financial services, this channel is Wise’s favorite. In the visual example of its referral program, Wise displayed three countries in different colors, with each dot representing a customer. Each connected dot is a customer they invited (or were invited by).

Wise claims that around two-thirds of new customers historically come through referrals. That allowed Wise to spend much less on marketing than its main competitors. However, the rapid slowdown in growth rate might compel Wise to consider more expensive acquisition channels.
Promotions: To attract new customers, money transfer providers typically offer an incentive for the first transfer, such as a gift card…

Money Transfer Acquisition Channels: Promotions, Remitly, May 2, 2015
… or a better foreign exchange rate:
Western Union started a rewards program in 2015, and MoneyGram followed suit in 2019. Unlike credit card rewards, where a merchant effectively pays for the product, in this case a company charges a customer a higher markup and then returns a small portion of that markup as a reward.

Source: X
Valuations across Incumbents and Fintechs
Fintechs are valued at a higher multiple of their revenue or transfer volume than traditional players since investors believe that they are better positioned for long-term growth:
Fintech startups are more than happy to support a narrative that they are disrupting incumbents and that all cash-based remittances will soon disappear. The irony, of course, is that some of the fintechs making such claims are no longer around.
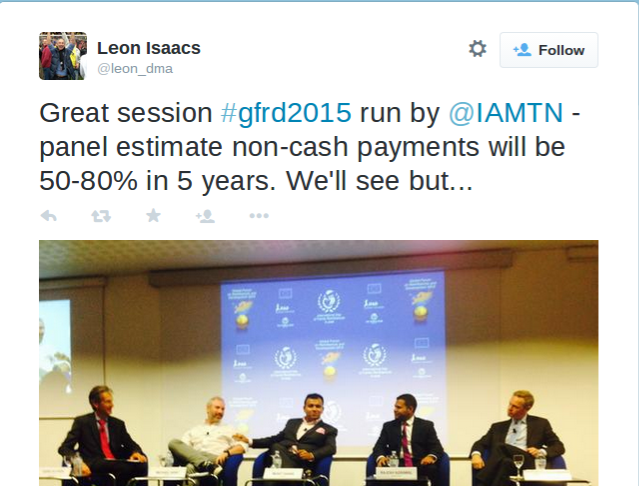
Remittance startups expectations for growth in online usage – June 2015
Here is Azimo’s founder predicting in 2018 that in 5-10 years, ALL offline locations will disappear. Guess who vanished in 2022 – Azimo.
VCs flush with cash during 2011-2021 and eager to fund fintechs. You can find their typical rationale in the articles below:
- Wise – Learning From My Mistakes,
- WorldRemit – Drive Global Growth.
Here is the core of their common investment thesis:
- “significant disruption” “clear shift to online-mobile”
- “no innovation” from incumbents
- startups offer much more “convenient, low-cost solutions.”
Today’s reality is “SLOW,” “WRONG,” and “SOMEWHAT” to the above investment thesis. The shift to online is crawling at 1-2% annually; incumbents have the same online/mobile tools as fintechs, if not better, and fintechs offer less convenience with fewer destinations and send/receive methods. Fintechs are sometimes more expensive than the digital arms of incumbents in the most competitive corridors.
That’s why Western Union’s revenue has remained stagnant for over a decade. Traditional MTOs and fintechs have been challenging its four-decade-long dominance, but Western Union hasn’t stood still. While it hasn’t become as effective as Ria, it has done just enough to avoid disruption — so far.
Western Union went online in 2000, began piloting mobile payments in 2007, and had a mobile app in 2011 before some fintechs launched theirs. This would also imply that Western Union should be considered a pioneering FinTech player that probably did more to connect the so-called “unbanked” than all remittance startups combined.
As with any industry, competitive pressures have taken a toll on many second-tier players. The disappearance of traditional MTOs such as Sigue and Small World coincided with the shutdown or sale of digital players such as Tuyyo and Azimo. Lean operations and hunger for growth among the remaining players suggest that some of today’s well-known traditional and digital providers won’t survive into the next decade.
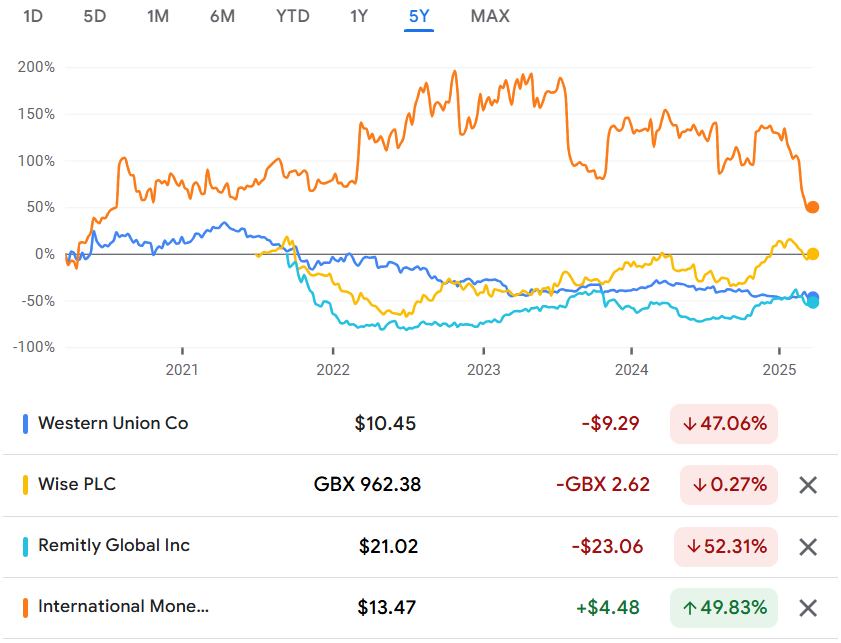
This unease over industry sustainability has even made investors wary of top-performing fintechs like Wise and Remitly. In a telling sign, the stocks of neither traditional MTOs nor fintechs have performed well over the last few years.
Over the past four-plus decades, the international money transfer industry has been transformed by novel business, operating, and technology models. Its relative simplicity continues to attract new players, while its services for lower-income migrants draw attention from the media and politicians. The clear winners have been the users. Whether any player will become as globally dominant as Google or Apple remains uncertain, but it seems unlikely.

Money Transfer: do startups pose a threat to incumbents?
In Conclusion
Thank you for reading our article! Hopefully, you found this overview helpful. If we got anything wrong or missed anything, we would really appreciate your suggestions in the comments section below. We will be keeping this post regularly updated – please come back soon!